Science Corner

Analysis Paper: Impact of Lead-Contaminated Soil on Public Health

U.S. DEPARTMENT OF HEALTH AND HUMAN SERVICES
Public Health Service
Agency for Toxic Substances and Disease Registry
Atlanta, Georgia 30333

Charles Xintaras, Sc.D., Office of the Assistant Administrator, ATSDR

(May 1992)


Table of Contents

Acknowledgement
Foreword

Introduction
Populations at risk
Sources of lead exposure
Extent of lead poisoning in children
Soil characterization
Particle size and lead content of house dust
Environmental fate of lead
Bioavailabilty of lead
Metabolic interactions of lead with nutrients
Health effects of lead exposure

Correlations of soil lead and blood lead in children
Duggan (1980), Duggan and Inskip (1985)
ATSDR (1988)
Madhaven et al (1989)
Reagan and Silbergeld (1989)
Environmental Protection Agency (1990)
Soil lead standards and recommendations
Public health impact of exposure to lead-contaminated soil
General principles and limitations in field evaluations
Community prevention activities

Summary

References
Figures
Point of contact for this document:


Acknowledgement

This document was downloaded from the CDC Prevention Guidelines on the WWWonder database and reformatted. The author of the report thanks the CDC staff responsible for the HTML coding of the original paper.

Special recognition is due the various ATSDR staff personnel who reviewed and critiqued drafts of this document, and who suggested changes to the text, many of which strengthened and clarified the final version. Among those individuals contributing to this paper, of particular note is Dr. Kenneth Orloff, Assistant Director for Science, Division of Health Assessment and Consultation, whose initial draft background paper on lead in soil formed the point of departure for the present document. Special thanks are due to the members of the ATSDR Science Forum for their many constructive criticisms of successive drafts and to the staff of the ATSDR Visual Information Center for their contribution on graphic design and typesetting. Ms. Jeanne Bucsela served as editor.

Foreword

Lead in the environment and its effects on the health of people is a matter of great concern to the Agency for Toxic Substances and Disease Registry (ATSDR). The Agency was established by the Comprehensive Environmental Response, Compensation, and Liability Act of 1980 (CERCLA, also known as Superfund) to assess the public health impact of hazardous wastes in the general environment, to identify human populations at risk, and to effect actions to prevent adverse health effects from human contact with hazardous substances. The Agency's emphasis is on hazardous substances released from waste sites and substances released under emergency conditions (e.g., chemical spills). Lead left in the environment as hazardous waste is a matter of great public health concern to ATSDR.

ATSDR's concern about lead's toxicity derives from several factors. In a report to Congress, The Nature and Extent of Lead Poisoning in Children in the United States, published by ATSDR in July 1988, exposure to lead was identified as a serious public health problem, particularly for children. The report also identified six major environmental sources of lead, including leaded paint, gasoline, stationary sources, dust/soil, food, and water. For leaded paint, the number of potentially exposed children under 7 years of age in all housing with some lead paint at potentially toxic levels is about 12 million. An estimated 5.6 million children under 7 years old are potentially exposed to lead from gasoline at some level. The estimated number of children potentially exposed to U.S. stationary sources (e.g. smelters) is 230,000 children. The range of children potentially exposed to lead in dust and soil is estimated at 5.9 million to 11.7 million children. Some actual exposure to lead occurs for an estimated 3.8 million children whose drinking water lead level has been estimated at greater than 20 mcg/dl.

CERCLA requires ATSDR and the Environmental Protection Agency (EPA) to jointly rank, in order of priority, hazardous substances found at sites on EPA's National Priorities List (NPL). The current list of prioritized hazardous substances numbers 275. The three criteria for ranking were frequency of occurrence at NPL sites, toxicity, and potential for human exposure. Lead is ranked as the number one priority hazardous substance. In view of this, exposure to lead in populations close to hazardous waste sites continues to be a public health issue of concern. ATSDR, in reaction to this concern, recently established a Lead Initiative to systematically review Superfund sites for which the Agency's Public Health Assessments indicate the presence of site-related lead contamination. The goal of this ATSDR initiative is to prevent lead toxicity in persons, especially young children, exposed to lead released from Superfund sites and facilities. For all sites on the NPL, lead occurred at 853 (66%) of the 1300 sites. Thirteen sites have been selected for in-depth follow-up in fiscal year 1992 by ATSDR scientists.

This report provides background information on the complex and interactive factors that environmental health scientists need to consider when evaluating the impact of lead-contaminated soil on public health. A definitive analysis of the impact on public health of lead-contaminated soil is limited often by a lack of information on human exposure factors and soil conditions. Each waste site, therefore, poses a unique challenge to the health assessor and each site should be assessed in terms of its own characteristics.

The development of action levels for lead in soil lies outside the scope of the present report. However, the health assessor will find the information in this report useful in characterizing the significance of exposure pathways and the importance of the physical and chemical properties of the lead compounds that may impact on persons' uptake of lead.

The correlation between lead-contaminated soil and blood lead (PbB) level continues to challenge investigators. Correlations cited in the literature are influenced in specific studies by many factors, including access to soil, behavior patterns (especially of children), presence of ground cover, seasonal variation of exposure conditions, particle size and composition of the lead compounds found at various sites and the exposure pathway. These complex factors explain in some instances discrepant findings that are reported in the literature.

The reader is cautioned that much research is ongoing to clarify relationships between lead in soil and the amount absorbed by humans. Therefore, the associations and mathematical relationships between soil lead concentrations and blood-lead levels cited in this paper should be understood as being what has been published in the scientific literature, but subject to change as newer information becomes available.

Barry L. Johnson, Ph.D.
Assistant Surgeon General
Assistant Administrator


Introduction

The Agency for Toxic Substances and Disease Registry (ATSDR) is mandated by the Comprehensive Environmental Response, Compensation, and Liability Act of 1980 (CERCLA or Superfund), as amended by the Superfund Amendments and Reauthorization Act of 1986 (SARA), to perform public health assessments for all sites on the National Priorities List (NPL). Data from health assessments for the first 951 sites show that metals and volatile organic compounds were the contaminants most often detected, and these commonly migrated from disposal areas to groundwater. Metallic substances occurred at 564 (59%) of the 951 sites, with lead, chromium, arsenic, and cadmium being cited most frequently (Susten, 1990).

The purpose of this analysis paper is to examine the relationship between exposure to lead-contaminated soil and the resulting impact on public health. The analysis will provide background information to ATSDR staff and other environmental health scientists responsible for preparing ATSDR documents, such as health assessments, health consultations, and emergency responses.

Emphasis in the analysis is given to the public health aspects of soil lead contamination at field sites. The analysis includes a review of the following areas: populations at high risk, sources of lead exposure, extent of lead poisoning in children, soil characterization, environmental fate of lead, bioavailability of lead, health effects of lead poisoning, correlations of soil lead and blood lead (PbB) in children, soil lead standards and recommendations, public health impact of exposure to lead-contaminated soil, general principles and limitations in field evaluations, and community prevention activities.

The Centers for Disease Control (CDC) Lead Statement for Preventing Lead Poisoning in Young Children is highlighted and provides guidelines on blood lead levels and childhood lead poisoning prevention (CDC, 1991). Examples in the use of the EPA Uptake/Biokinetic Model (Version 0.5) for estimating PbB levels from multiple exposure pathways are included.

Data gaps, such as usage patterns and soil condition, that limit a definitive analysis on the impact of soil on public health are discussed to the extent that information is available. Therefore, the development of action levels for lead in soil lies outside the scope of this document. Interactive and complex factors associated with multiple exposure pathways for lead require a site-specific approach in order to develop meaningful action levels for lead in soil. Identification and discussion of soil remediation protocols are also not within the scope of this analysis.

Populations at risk

Preschool-age children and fetuses are usually the most vulnerable segments of the population for exposures to lead (ATSDR, 1988). This increased vulnerability results from a combination of factors including: 1) the developing nervous system of the fetus or neonate has increased susceptibility to the neurotoxic effects of lead; 2) young children are more likely to play in dirt and to place their hands and other objects in their mouths, thereby increasing the opportunity for soil ingestion (pica--the eating of dirt and other non-food items--is more likely to occur in children); 3) the efficiency of lead absorption from the gastrointestinal tract is greater in children than in adults; and 4) nutritional deficiencies of iron or calcium, which are prevalent in children, may facilitate lead absorption and exacerbate the toxic effects of lead.

Among children, those in the 2-3 year-old age bracket may be most at risk for exposure to lead-contaminated soil. Mahaffey et al. (1982) reported that children in this age group had the highest PbB concentrations. This is also the age group in which pica tendencies are most prevalent (ATSDR, 1988).

Sources of lead exposure

Several major sources of lead exposure have been identified (ATSDR, 1988). Leaded paint continues to cause most of the severe lead poisoning in children in the United States. It has the highest concentration of lead per unit of weight and is the most widespread of the various sources, being found in approximately 21 million pre-1940 homes. Dust and soil lead--derived from flaking, weathering, and chalking paint--plus airborne lead fallout and waste disposal over the years, are the major proximate sources of potential childhood lead exposure. Lead in drinking water is intermediate but highly significant as an exposure source for both children and the fetuses of pregnant women. Food lead also contributes to exposure of children and fetuses.

Individuals may be exposed to lead through several sources. When evaluating a site, a health assessor should be aware of multiple sources of lead exposure and the additive nature of the risks. An important source of lead exposure in older homes is contact with interior or exterior surfaces that have been painted with lead-based paints. Some individuals may be exposed to lead from occupational or hobby sources or from other less-common sources, such as the use of lead-glazed pottery, stained glassworking, and target practice in poorly ventilated indoor firing ranges.

Extent of lead poisoning in children

The 1988 Agency for Toxic Substances and Disease Registry (ATSDR) report on the extent of lead poisoning in the United States estimated that in the 1984 standard metropolitan statistical areas 2.4 million white and black children aged 6 months through 5 years had PbB levels above 15 mcg/dl and 200,000 children above 25 mcg/dl. This would correspond to approximately 3 million and 250,000, respectively, for all children 6 months through 5 years in the total U.S. population.

The actual number of children exposed to lead in dust and soil at concentrations adequate to elevate PbB levels cannot be estimated with the data now available. However, the number of children potentially exposed to lead in dust and soil can be stated as a range of potential exposures to the primary sources of lead in dust and soil, namely, paint lead and atmospheric lead fallout. This range is estimated at 5.9 to 11.7 million children (ATSDR, 1988).

Soil characterization

Soil is contaminated by lead from various sources (American Academy of Pediatrics, 1987). Lead particles are deposited in the soil from flaking lead paint, from incinerators (and similar sources), and from motor vehicles that use leaded gasoline. Waste disposal is also a factor. Urban environments in general have received higher depositions of lead from vehicular emissions than have rural areas.

In many lead-mining districts, the predominant form of lead is galena or lead sulfide. However, the mineral deposits in Leadville, Colorado, are unusual (Colorado Department of Health, 1990). In Leadville, the mineral forms of lead are predominantly cerusite (lead carbonate), anglesite (lead sulfate), and massicot (lead oxide).

Wide variations in soil lead levels have been reported, ranging from less than 100 ppm to well over 11,000 ppm (National Research Council, 1980). Natural levels of lead in surface soils are usually below 50 ppm (Chaney et al. 1984; Reagan and Silbergeld, 1989). Soils adjacent to houses with exterior lead-based paints may have lead levels of >10,000 mcg/g (EPA 1986).

Particle size and lead content of house dust

Que Hee et al. (1985) measured the lead content in samples of house dust categorized into fractions by particle size collected in Cincinnati, Ohio (Table 1). The Que Hee et al. study shows that lead concentration is generally independent of particle size and that the bulk of the dust particles are concentrated in the smaller size ranges. Note that 77% of the lead was present in particles smaller than 149 mcm. This distribution of lead in small particles would maximize intestinal absorption.

Table1. Normal house dust by particle size and lead content
(Que Hee et al. 1985, adapted by Steele et al.1990)
Size range (µm) Weight % of fractionated dust Lead content µgPb/g of dust fraction % Lead in unfractionated dust
‹44 18 1440 21
44-149 58 1180 56
149-177 4.5 1330 4.9
177-246 2.7 1040 2.3
246-392 6.1 1110 5.6
392-833 11 1090 9.6
Unfractionated Dust 100 1214 ± 13ª 100

ª = Standard deviation

Environmental fate of lead

Air: Lead particles are emitted from automobiles to the atmosphere as lead halides (e.g., PbBrCl) and as the double salts with ammonium halides (e.g., 2PbBrCl NH4Cl); lead particles are emitted from mines and smelters primarily in the form of PbSO4, PbO.PbSO4, and PbS (EPA, 1986). In the atmosphere, lead exists primarily in the form of PbSO4 and PbCO3 (EPA, 1986). How the chemical composition of lead changes in dispersion is not clear.

Water: Lead has a tendency to form compounds of low solubility with the major anions found in natural water (Table 2). In the natural environment, the divalent form (Pb2+) is the stable ionic species of lead. Hydroxide, carbonate, sulfide, and, more rarely, sulfate may act as solubility controls in precipitating lead from water. A significant fraction of lead carried by river water is expected to be in an undissolved form. This can consist of colloidal particles or larger undissolved particles of lead carbonate, lead oxide, lead hydroxide, or other lead compounds incorporated in other components of surface particulate matter from runoff. The ratio of lead in suspended solids to lead in dissolved form has been found to vary from 4:1 in rural streams to 27:1 in urban streams (EPA, 1986).

Table 2. Solubility of lead and lead compounds (ATSDR, 1992)
Element / Compound Solubility
  Water Organic solvents
Lead Insoluble Insoluble
Lead acetate 221g/100ml at 50°C Soluble in glycerol, very slight in alc.
Lead chloride 0.99 g/100ml at 20°C Insoluble in alcohol
Lead chromate 0.2 mg/L Insoluble in acetic acid
Lead nitrate 37.65-56.5 g/100ml at 0°C 1 g in 2,500 ml absolute alcohol
1 g in 75 ml absolute methanol
Lead oxide 0.001 g/100 cc at 20°C (Litharge)
0.0023 g/100 cc at 23°C (Massicot)
Soluble in alkali chlorides
Soluble in alkali (Massicot)
Lead sulfate 42.5 mg/L at 25°C Insoluble in alcohol

Soil: Paint is a major contributor to soil lead contamination. Remediation of exterior lead-based paint hazards is critical if further contamination is to be avoided (Binder and Matte, 1992). The accumulation of lead in soil is primarily a function of the rate of deposition from the atmosphere. The fate of lead in soil is affected by the specific or exchange adsorption at mineral interfaces, the precipitation of sparingly soluble solid phases, and the formation of relatively stable organo-metal complexes or chelates with the organic matter in soil (EPA, 1986; NSF, 1977).

Evidence exists that atmospheric lead enters the soil as lead sulfate or is converted rapidly to lead sulfate at the soil surface. Lead sulfate is relatively soluble, and thus could leach through the soil if it were not transformed. In soils with pH of > or = 5 and with at least 5% organic matter, atmospheric lead is retained in the upper 2-5 cm of undisturbed soil (EPA, 1986).

Lead may mobilize from soil when lead-bearing soil particles run off to surface waters during heavy rains. Lead may also mobilize from soil to atmosphere by downwind transport of smaller lead- containing soil particles entrained in the prevailing wind (NSF, 1977). This latter process may be important in contributing to the atmospheric burden of lead around some lead-smelting and Superfund sites that contain elevated levels of lead in soil.

The downward movement of lead from soil by leaching is very slow under most natural conditions (NSF, 1977). The conditions that induce leaching are the presence of lead in soil at concentrations that either approach or exceed the sorption capacity of the soil, the presence in the soil of materials that are capable of forming soluble chelates with lead, and a decrease in the pH of the leaching solution (e.g., acid rain) (NSF, 1977). Partial favorable conditions for leaching may be present in some soils near lead- smelting and NPL sites that contain elevated levels of lead in soil.

Bioavailabilty of lead

Barltrop and Meek (1975) examined the absorption in rats of 12 different lead compounds following oral exposure, including solids and oily, viscous liquids, compared with lead acetate absorption. The kidney contents of lead were calculated as percentages of the relevant lead acetate values (Table 3). The absorption of metallic lead (particle size 180-250 mcm) was lower than the absorption of lead salts (particle size < 50 mcm). Lead carbonate had the highest absorption, which, the authors suggest, may reflect the greater solubility of this compound in gastric juice.

Table 3. Absorption by rat kidney of lead additives compared with lead acetate
(Barltrop and Meek, 1975)
Lead compound Percent absorption
compared with lead acetate
Control (no lead) 4
Metallic lead
(particle size 180-250 µm)
14
Lead chromate 44
Lead octoate 62
Lead naphthenate 64
Lead sulfide 67
Lead tallate 121
Lead carbonate (basic) 164

A key factor in the solubility of lead is the pH of the fluid. Healy et al. (1982) measured the solubility of lead sulfide (particle size approximately 90 mcm) in several fluids, including water, saliva, and gastric juice. The lead was relatively insoluble in water and saliva, but was 800 times more soluble in simulated gastric juice. Day et al. (1979) measured the solubility (extractability) in hydrochloric acid of lead from street dust collected in two industrial cities. The authors assumed that the lead compounds were primarily oxides and halides emitted from automobiles. Under environmental conditions, these compounds can be converted to carbonates and sulfates. Less than 10% of the lead was extracted at pH 4 and higher; more than 80% was extracted at pH 1, the nominal pH of gastric juice. The significance of these findings is not clear because the temperature of extraction did not correspond to physiological conditions (37 C) and hydrochloric acid is a simplistic simulation of gastric juice. Other studies have supported the higher degree of solubilization at a pH about 1 of lead from street dust samples (Duggan and Williams, 1977; Harrison, 1979).

Metabolic interactions of lead with nutrients

Mahaffey and co-workers (1976) reported that children with elevated PbB had lower dietary intakes of calcium and phosphorus than did a reference population. Heard and Chamberlain (1982) reported similar findings. Several studies have shown a strong inverse correlation between iron status and PbB (Chisolm,1981; Yip et al., 1981; Watson et al., 1980). Zinc deficiency can also enhance lead absorption (Markowitz and Rosen, 1981).

The main conclusion to be drawn from studies of lead-nutrient interactions is that defects in nutrition will enhance lead absorption and retention and thus the toxicity risk. This problem is amplified when nutrient deficiencies are commonplace and lead exposure is highest, that is, in 2-to 4- year-old, underdeveloped children (ATSDR, 1988).

Improving the nutritional status of children who have a high risk of exposure and toxicity greatly increases the effectiveness of environmental lead abatement. However, nutritional supplement (calcium) only increases the lead level required for toxicity rather that eliminating lead uptake and its effects (Mahaffey, 1982).

The levels of phosphorus, which indicate Vitamin D levels, suggest that most poor children's intake of this vitamin is adequate (ATSDR, 1988). Vitamin D enhances lead uptake in the gut, but its intake is essential to health and cannot be reduced (ATSDR, 1988).

Health effects of lead exposure

Studies on the effects of lead in children have demonstrated a relationship between exposure to lead and a variety of adverse health effects. These effects include impaired mental and physical development, decreased heme biosynthesis, elevated hearing threshold, and decreased serum levels of vitamin D (Figure 1). The neurotoxicity of lead is of particular concern, because evidence from prospective longitudinal studies has shown that neurobehavioral effects, such as impaired academic performance and deficits in motor skills, may persist even after PbB levels have returned to normal (Needleman, 1990). Although no threshold level for these effects has been established, the available evidence suggests that lead toxicity may occur at PbB levels of 10-15 mcg/dl or possibly less (ATSDR 1988).

Additional information on lead toxicity is contained in The Nature and Extent of Lead Poisoning in Children in the United States: A Report to Congress (ATSDR, 1988) and the ATSDR Toxicological Profile for Lead (ATSDR, 1992).

Correlations of soil lead and blood lead in children

Every community and every study reflects a different range of soil lead concentrations and blood lead levels. Several comprehensive reviews have examined the quantitative relationship between exposure to lead-contaminated soil and PbB levels in children. This result is commonly expressed in the literature as a dose- response relationship and reflects a change in PbB levels with the change in soil lead concentrations (assuming a linear relationship between the two) scaled to a standard unit of soil lead concentration (either 1,000 mcg/g or 100 mcg/g) (Reagan and Silbergeld, 1989).

Duggan (1980), Duggan and Inskip (1985)

Duggan compiled data from published studies that reported a quantitative correlation between PbB concentrations and lead concentrations in soil or dust (Duggan, 1980; Duggan and Inskip, 1985). Duggan included data from sites with diverse sources of lead contamination (e.g., lead mining, smelting, lead paint, automobile exhaust emissions). The data indicated that the increase in PbB levels associated with exposures to lead in soil varied between 0.6 and 65 mcg lead/dl blood per 1000 ppm lead in soil. As an average value, Duggan suggested that exposure to soil containing 1000 ppm of lead could increase the PbB level by 5 mcg/dl. No value for an acceptable concentration of lead in soil was offered because such a value would depend on what constitutes an acceptable increase in the PbB concentration.

ATSDR (1988)

In the ATSDR document, The Nature and Extent of Lead Poisoning in Children in the United States: A Report to Congress, it was noted that several investigations have shown a highly significant correlation between PbB levels and lead concentrations in dust and soil. Several references were cited that describe quantitative relationships between PbB levels and soil or dust lead levels. The report concluded, "In general, lead in dust and soil at levels of 500 to 1,000 ppm begins to affect children's PbB levels."

Madhaven et al (1989)

Madhaven et al. (1989) used the data compiled by Duggan (1980) to derive a "safe" or permissible level of lead in soil. The authors based their analysis on 8 of Duggan's 21 slope estimates for PbB vs. soil lead. Madhaven et al. selected those studies for which soil was believed to be the only source of lead and for which the susceptible population were children under 12 years of age. The geometric mean of the 8 studies was 3.41 mcg lead/dl blood per 1000 ppm lead in soil, and the 95 percentile upper confidence interval was 8.59 mcg/dl per 1000 ppm. The authors proposed permissible levels of lead in soil ranging from 250 to 1000 ppm depending on site conditions. The 250 ppm value applies to a worst-case scenario in which children below 5 years of age repeatedly used an area without grass cover and mouthed objects frequently. In this situation, a soil lead concentration of 250 ppm would add, at most, an estimated 2 mcg/dl to the PbB level of children.

Reagan and Silbergeld (1989)

Recently Reagan and Silbergeld (1989) summarized the findings of several studies dealing with observed relationships between environmental lead concentrations and body lead burdens in young children (Table 4).

Table 4 . Dose response relationships between soil Pb concentrations and blood Pb levels
(Reagan and Silbergeld, 1989)
Study² Dose response relationships¹
Change in blood Pb
per 1000 µg/g soil lead
Change in blood Pb
per 100µg/g soil lead
Urban communities
Angle and McIntire (1982) 15.5* 1.6
Brunekreef et al. (1983) 11.3* 11.1
Stark et al. (1982) 10.2* 1.0
Davies et al. (1987) 10.0 1.0
Haan (personal communication) 10.0 1.0
Madhaven et al. (1989) 9.0 .9
Reeves et al. (1982) 8.1* 0.8
Rabinowitz et al. (1985) 8.0 .8
Bornschein (1986) 6.2 0.6
Shellshear et al. (1975) 3.9* 0.4
Lead industries communities
Brunekreef et al. (1981) 12.6* 1.3
Landrigan et al. (1975) 11.7* 1.2
Neri et al. (1978) 11.2* 1.1
Yankel et al. (1977) 7.3* 0.7
Roberts et al. (1974) 5.3* 0.5
Galke et al. (1975) 4.9* 0.5
Mining communities
Gallacher et al. (1974) 4.1 0.4
Barltrop et al. (1974) 0.6* 0.1
Review articles
Brunekreef et al. (1986) 5-10 0.5-1.0
AAP (1987) 5-10 1.0-2.0³
Duggan (1980, 1983) 5 0.5
EPA (1986a) 2 0.2

¹ This table reflects unadjusted values (calculated by Brunekreef (1986) and
noted by an * and values in other studies calculated by the authors of the study.
² See Reagan and Silbergeld (1989) for full citations for these references.
³ Covering the range of 500-1,000 µg/g only.

Reagan and Silbergeld (1989) analyzed the review articles by Brunekreef (1986), American Academy of Pediatrics (AAP) (1987), Duggan (1980), Duggin and Inskip (1985), and EPA (1986) and reported several limitations in the articles. In the Brunekreef review, most studies reviewed "do not permit straightforward calculation of (a dose-response relationship) which are properly adjusted for relevant confounders". Nevertheless, Brunekreef concluded that the dose-response relationship was in the 5.0-10.0 (mcg/dl per 1,000 mcg/g) range for lead in soil, housedust, streetdust, and playground dust. After reviewing several studies Duggan also concluded that the dose-response relationship of PbB to soil lead concentration is 5 mcg/dl per 1000 mcg/g which is very close to his theoretical calculation of 7 mcg/dl per 1,000 mcg/g. Brunekreef criticized Duggan's review because he relied heavily on studies in which one or more pathways were excluded and used adjusted instead of unadjusted values in some studies.

The review by the AAP notes that for each increase of 100 mcg/g in the lead content of surface soil above a level of 500 mcg/g a mean increase of 1 to 2 mcg/dl occurs in children's whole PbB (AAP 1987). No explanation was given in the AAP study for starting the slope at a soil lead value of 500 mcg/g. Reagan and Silbergeld (1989) also criticized the EPA review for selecting only two studies (Stark et al., 1982; Angle and McIntire, 1982), which

EPA believed provided good data for the slope estimates (2.2 mcg/dland 6.8 mcg/dl) and then selecting the lowest one as a "median estimate" without explaining why this selection technique is appropriate. Brunekreef also criticized the EPA conclusion because EPA mixed adjusted and unadjusted values and because use of an adjusted value in the Stark study was inappropriate.

The dose-response relationship differs between urban and industrial communities and lead-mining communities, with lead-mining communities having a shallower slope (Reagan and Silbergeld, 1989). This difference is probably due to a difference in the bioavailabilty of lead. Particle size and metal species are also thought to be major factors (Colorado Department of Health, 1990). However, differences in modulating factors (such as nutrition) may also have been important in these studies.

With regard to particle size, leaded gasoline, which is the predominant source of lead in urban communities, and industrial point sources emit small particles, whereas mines and tailing piles release relatively large particles, primarily as fugitive dusts (EPA, 1986). Smaller particles may be inhaled and ingested, increasing total exposure. Smaller particles are easily transferred to the hands and tend to remain on the hands longer, thereby increasing the potential for ingestion.

With respect to metal species, Steele et al. (1990) noted that the impact of lead in soil derived from mine waste (usually in the form of PbS) on blood lead is less than that for lead in soil derived from smelter, vehicle, or point sources. However, in an animal study, tailing material from Midvale, Utah, was found to be more available to young pigs than was reagent grade PbS when presented as a single large dose by intubation (LaVelle et al. 1991). This study does not lend support to the Steele finding.

Environmental Protection Agency (1990)

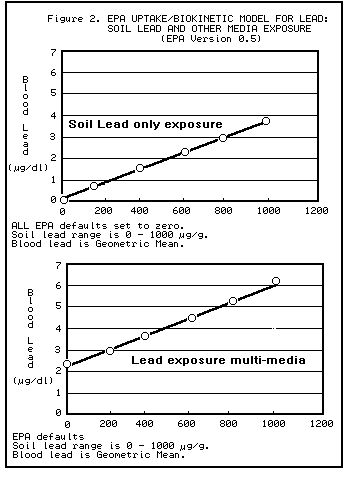
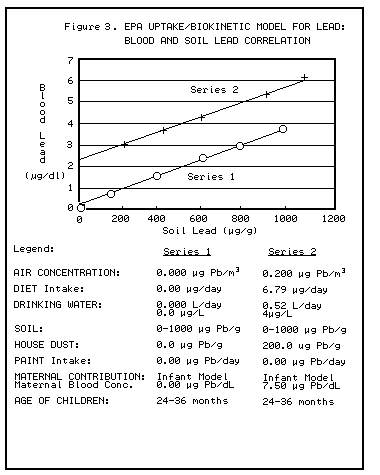
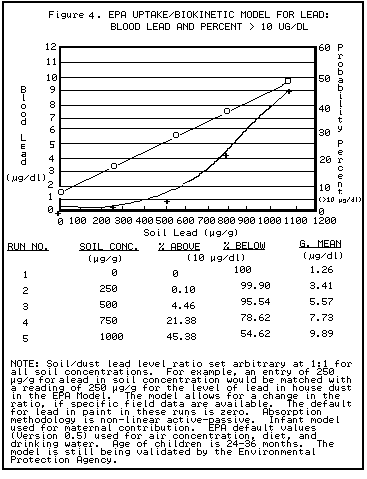
The U.S. Environmental Protection Agency (EPA) recently developed an Integrated Uptake/Biokinetic (IU/BK) model that examines the relationship between environmental exposure to lead and PbB levels. Examples in the use of this EPA model (Version 0.5) are shown in (Figure 2), (Figure 3), (Figure 4). This model is not used to set clean-up standards per se. Rather, it allows the health assessor to make site-specific calculations for children 6 yrs of age and under for PbB levels resulting from exposures to lead in soil, dust, air, water, and the diet. Several assumptions and default exposure variables are built into the model for use when these parameters are not known. The model is still being validated by the EPA.

Soil lead standards and recommendations

Many governments have promulgated soil lead standards or issued guidelines for lead in soil (Table 5).

Table 5. Soil lead standards for residential land use.
(Adapted from Reagan and Silbergeld, 1989)
Location Residential
U.S. (2,3,4) 500 (a)
Minnesota (4,5) 500 (b)
OME, Canada (2,6) 375 (c)
500 (d)
Netherlands (9) 50 (f)
150 (g)
600 (h)
England (8,10) 500 (i)
London 500 (j)

(a) 600 µg/g repealed, changed to leachate standard,
interim 500 µg/g guideline
(b) proposed emergency rule, interim 1000 µg/g standard
(c) sandy soil
(d) non-sandy soil
(f) reference value
(g) further investigation
(h) clean up value
(i) redevelopment of industrial lands
(j) dust standard

Sources cited (see Reagan and Silbergeld, 1989, for full citations): (2) Rinne et al. (1986); (3) Office of Solid Waste and Emergency Response (OSWER) (1989); (4) personal communication; (5) Minnesota Hazardous Waste Regulations; (6) Ontario Ministry of the Environment (OME) (1986); (8) Davies and Wixson (1986); (9) Assink and Vanderbrink (1986); (10) Department of the Environment (DOE,UK,1987); (11) Wilson (1983).

Researchers have also calculated "acceptable" levels of lead in soil or dust (Table 6).

Table 6. Soil lead standard recommendations
(Adapted from Reagan and Silbergeld, 1989)
Author(s) Standard (ppm) Comments
Shelshear et al. (1975) <100 Protect pica children
Mielke et al. (1989) <150 Prevent lead toxicity (10 µg/dl
Chaney et al. (1986, 1989) <150 Protect pica children
Duggan and Williams (1977) 300 Keep ADI <50 µg/Pb/day (street dust standard)
Boucier et al. (1985) 300 Keep blood lead below 25 µg/dl
Simms and Becket (1987) 500 Keep blood lead below 25 µg/dl
Madhaven et al. (1989) 600
250
Permit an increase in blood lead of 5 µg/dl above existing levels
Protect children where there is no grass cover
Steenhout (1987) 900 Based upon an ADI of 200 µg Pb/day
Laxen et al. (1987) 1000 Allows dust to contribute 2.5-3.0 µg/dl (housedust)

Reagan and Silbergeld (1989) also noted an order of magnitude difference in the recommendations offered in the literature. The standards reflect four basic arguments to justify or advocate a specific lead limitation.

  1. To protect pica children, a lead soil standard should be below 100 mcg/g (Shellshear et al. (1975)) or 150 mcg/g, (Chaney et al. (1986,1989)).

  2. To keep PbB levels below 25 mcg/dl a standard of 300 (Bourcier et al. (1985)) and 500 mcg/g (Simms and Becket 1987)) is needed. Mielke et al. (1989) also argue that to keep PbB lvels below 10 mcg/dlthe standard should be less than 150 mcg/g.

  3. Based on an Acceptable Daily Intake (ADI) of 50 and 200 mcgPb/day, respectively, soil levels of 300 (Duggan and Williams (1977)) and 900 mcg/g (Steenhout (1987)) are recommended.

  4. Laxen et al. (1987) and Madhaven et al. (1989) argue for a standard that would allow PbB levels to increase by 3-5 mcg/dl over and above existing PbB levels. Madhaven et al. also argue that children exposed to lead at 250 mcg/g in bare soils could have increased PbB levels of 2 mcg/dl.

Reagan and Silbergeld (1989) have normalized the recommendations noted in the previous table (Table 7). They assumed a linear relationship and that all the lead comes from soil and dust.

Table 7. Normalized soil lead standard recommendations
(Reagan and Silbergeld, 1989)
Author(s) Recommended standard (ppm) Normalized (ppm)
Shelshear et al. (1975) <100 <100
Mielke et al. (1989) <150 <150
Chaney et al. (1986, 1989) <150 <150
Duggan and Williams (1977) 300 150
Boucier et al. (1985) 300 120
Simms and Becket (1987) 500 200
Madhaven et al. (1989) 600
250
120
50
Steenhout (1987) 900 112
Laxen et al. (1987) 1000 333

In recommending a soil lead standard, Reagan and Silbergeld argue that

  1. No one should have a PbB level greater than 10 mcg/dl;
  2. pica children should be protected;
  3. soil and dust lead exposure should not be allowed to increase PbB levels; and
  4. (indirectly) the total allowable daily intake (ADI) of lead should not exceed 25 mcg.

Reagan and Silbergeld (1989) caution that the "normalized" values reflect the assumption that all allowable lead came from soil or dust. A further downward revision should be made to allow for other sources that contribute to total body lead burden for all populations. The Laxen et al. value, Reagan and Silbergeld point out, was not adjusted for age (he examined 10-12 year-old children, instead of the high-risk, 2-4 year-old children).

Finally, Reagan and Silbergeld argue "that the literature as a whole supports a low soil lead standard of 100 mcg/g or so." In proposing this standard, Reagan and Silbergeld (1989) also proposed that the standard:

  1. Be limited to residential areas;
  2. Be a bare soil standard, if and only if, the community can guarantee adequate ground cover, essentially forever;
  3. Be based on a soil survey;
  4. Be applicable to property based on sample type;
  5. Be enforceable;
  6. Include a soil replacement standard;
  7. Take into account soil type (i.e., the standard should be lower for sandy soil or soils having a low content of organic matter).

Public health impact of exposure to lead-contaminated soil

A strong positive correlation is found between exposure to lead-contaminated soils and PbB levels. Generally, PbB levels rise 3-7 mcg/dl for every 1000-ppm increase in soil or dust lead concentrations (CDC, 1991). This range reflects different sources of lead, different exposure conditions, and different exposed populations.

At all sites, ATSDR recommends that health assessors evaluate the need for any follow-up health activities. This effort should be coordinated with other health agencies, as appropriate, to ensure that all aspects of a site that impact the health of the community are evaluated. Environmental health scientists will find the recent statement by CDC, Preventing Lead Poisoning in Young Children, a very useful resource (CDC, 1991).

Ideally, to determine the public health impact of environmental lead contamination at a site, a biomarker of lead exposure in the exposed population should be available. The most commonly used biomarkers of lead exposure are the PbB concentration and the blood erythrocyte protoporphyrin (EP) concentration. Although blood EP levels are commonly used in lead screening programs, the EP test has poor sensitivity and specificity below a PbB level of 25 mcg/dl (CDC, 1991). Therefore, PbB concentration is a more sensitive indicator of low-level lead exposures. CDC recommends PbB concentration as the screening test of choice (CDC, 1991).

To assess the potential for lead toxicity at a site, the health assessor should first examine the available PbB data. CDC has reported guidelines for interpreting PbB test results in children and recommendations for follow-up activities (Table 8).

Table 8. Interpretation of blood lead test results and follow-up activities:
Class of child based on blood lead concentrations
Class Blood lead concentration (µg/dl Comment
I = or < 9 A child in Class I is not considered to be lead- poisoned
IIA 10-14 Many children (or a large proportion of children) with blood lead levels in this range should trigger community-wide childhood lead poisoning prevention activities. Children in this range may need to be screened more frequently.
IIB 15-19 A child in Class IIB should receive nutritional and educational interventions and more frequent screening. If the blood lead levels persist in this range, environmental investigation and intervention should be done.
III 20-44 A child in Class III should receive environmental evaluation and remediation and a medical evaluation. Such a child may need pharmacologic treatment of lead poisoning.
IV 45-69 A child in Class IV will need both medical and environmental interventions, including chelation therapy.
V = or > 70 A child in Class V lead poisoning is a medical emergency. Medical and environmental management must begin immediately

(Adapted from CDC, Preventing Lead Poisoning in Young Children. A Statement by the Centers for Disease Control, October, 1991. U.S. Department of Health aand Human Services/Public Health Service) If PbB levels are elevated, exposure to lead-contaminated soil may not be the only source for the increased blood level. Other lead sources - -such as lead from food, water, or air--could be partially or primarily responsible for the elevated PbB. These other potential exposure pathways should be thoroughly evaluated.

Even if PbB levels are not elevated, the site should not be dismissed as posing no potential public health hazard. Potential seasonal variation of exposure conditions; the half-life of lead in the blood stream; and limitations of any screening methods used, especially study design (power and representativeness of blood and soil samples), should be evaluated. If conditions at a site change dramatically, retesting exposed individuals may be necessary to determine the impact of altered conditions on PbB levels. Commonplace changes may also be significant in altering PbB levels.

The results of occupational studies indicate that increased exposures to lead are followed by elevations in PbB levels, which reach a new level in 60-120 days (Tola et al. 1973). Also, PbB levels may be higher in children during the summer months presumably as the result of increased opportunity for exposures through outdoor play.

The biologic fate of inorganic lead in the human body is well known. Inorganic lead is not metabolized but is directly absorbed, distributed, and excreted. Once in the blood, lead is distributed primarily among three compartments--blood, soft tissue (kidney, bone marrow, liver, and brain), and mineralizing tissue (bones and teeth). Mineralizing tissue contains about 95% of the total body burden of lead in adults (ATSDR, 1990).

In blood, 99% of the lead is associated with erythrocytes; the remaining 1% is in the plasma and is available for transport to the tissues. In single-exposure studies with adults, lead has a half- life in blood of approximately 25 days; in soft tissue, about 40 days; and in the non-labile portion of bone, more than 25 years. In bone there is both a labile component, which readily exchanges lead with the blood, and an inert pool. Lead in the inert pool poses a special risk because it is a potential endogenous source of lead. Because of these mobile lead stores, a person's PbB level can take several months or sometimes years to drop significantly, even after complete removal from the source of lead exposure (ATSDR, 1990).

In Leadville, Colorado, the Colorado Department of Health examined the impact of residential soil lead contamination on the PbB levels of children (Colorado Department of Health, 1990). Lead smelting operations in the area ended in 1961, and, at the time of the study in 1987, only one lead and zinc mine was still operating. An increase in soil lead concentration from 100 to 1100 ppm was associated with an estimated increase of 3.9 mcg/dl in the PbB concentration.

The results of several studies have indicated that the increase in PbB concentration as a function of soil lead concentration is not linear. That is, at higher lead concentrations in soil, the rate of increase in PbB levels falls off. Using data from exposure studies conducted at Helena Valley in Montana and Silver Valley in Idaho, Schilling and Bain (1989) derived the following linear regression model for the correlation between PbB levels and soil lead levels:

ln (blood lead level) = 0.879 + 0.241 ln (soil lead level)

Using this equation, an increase in soil lead from 100 ppm to 1100 ppm would increase the predicted PbB level from 7.3 mcg/dl to 13.0 mcg/dl, an increase of 5.7 mcg/dl. A further increase in soil lead to 2100 ppm would increase the estimated PbB level to only 15.2 mcg/dl.

The non-linearity of the dose-response curve for blood lead vs. soil lead is not unique to soil lead exposures. The rate of increase in PbB levels has also been observed to decrease upon exposure to high concentrations of lead in air or drinking water (Hammond, 1982).

Under the Superfund Amendments and Reauthorization Act of 1986, EPA (1991) initiated a "pilot program for the removal, decontamination, or other actions with respect to lead-contaminated soil in one to three metropolitan areas". One study, the Three City Urban Soil-Lead Demonstration Project, was designed to investigate whether the use of low-technology abatement methods to reduce environmental lead concentrations (soil, dust) would result in decreased PbB levels in children. Findings from this study are expected in the summer of 1992. It is possible that the impact of contaminated soil, like that of paint, is highly dependent on condition and usage patterns. This issue has not been adequately evaluated (Binder and Matte, 1992).

General principles and limitations in field evaluations

Screening tests

The erythrocyte protoporphyrin level is not sensitive enough to identify children with elevated PbB levels below about 25 mcg/dl. The screening test of choice is now PbB measurement (CDC 1991).

Dose-response curve

When assessing the public health impact of environmental lead contamination, the lower portion of the dose-response curve for PbB vs. soil lead should be used. This portion of the curve has the steepest slope, and it corresponds to conditions in which the impact on PbB is the greatest.

PbB levels generally rise 3-7 mcg/dl for every 1,000-ppm increase in soil or dust lead concentrations (CDC 1991). Access to soil, behavior patterns, presence of ground cover, seasonal variation of exposure conditions, and other factors may influence this relationship.

Sample size

Caution should be used in drawing conclusions when only one or a few soil samples from a site have been analyzed. Depending on the uniformity of lead distribution at a site, a single soil sample may significantly overestimate or underestimate the average lead concentration at a site.

Surface soil

Because lead is immobilized by the organic component of soil, lead deposited from the air is generally retained in the upper 2-5 centimeters of undisturbed soil (EPA 1986). Urban soils and other soils that are disturbed or turned under may be contaminated down to far greater depths. Opportunity for exposure is much greater to surface soil than to subsurface soils.

Evidence for the non-uniformity of lead distribution in urban soils was demonstrated in a study that examined soil lead concentrations in urban Baltimore gardens (Chaney 1984). Soil lead concentrations varied more than 10-fold within a single garden.

Chemical form of lead

The impact of exposure to lead-contaminated soil on PbB levels is also influenced by the chemical and physical form of the lead. Data from animal feeding studies suggest that the oral bioavailability of lead sulfide and lead chromate is significantly less than the bioavailability of other lead salts (oxide, acetate) (Barltrop and Meek 1975).

Particle size

Increasing the particulate size also reduces the bioavailability of lead in the gastrointestinal tract. In animal feeding studies, decreasing the lead particulate size from 197 microns to 6 microns resulted in a 5-fold enhancement in absorption (Barltrop and Meek 1979). The lead content of soil and dust has also been demonstrated to vary dramatically as a function of particle size (Duggan and Inskip, 1985). Several studies have reported that the lead content of soil, street dust, city dust, and house dust increases as the particle size decreases.

Lead-mining sites

The results of studies at lead-mining sites have indicated that soil lead contamination from mine tailings may be less effective in increasing PbB levels than is lead contamination derived from urban lead pollution (paint, gasoline) or atmospheric lead fallout from lead smelting operations (Steele et al. 1990). However, an animal study by LaVelle et al. (1991) on the bioavailability of lead in mining wastes following oral intubation in young swine does not support these findings.

The reduced bioavailability of lead from mine tailings may be related to its chemical form (lead sulfide) and its larger particulate size. Evaluations of mining sites require analyses of these physical-chemical parameters.

Community prevention activities

Pathways of Exposure

Soil and dust act as pathways to children for lead deposited by primary lead sources such as lead paint, leaded gasoline, and industrial or occupational sources of lead (CDC 1991).

Because lead does not dissipate, biodegrade, or decay, the lead deposited into dust and soil becomes a long-term source of lead exposure for children. For example, although lead emissions from gasoline have largely been eliminated, an estimated 4-5 million metric tons of lead previously used in gasoline remain in dust and soil, and children continue to be exposed to it (ATSDR 1988).

Prevention activities

Community prevention activities should be triggered by PbB levels > or = 10 mcg/dl, as recommended by the Centers for Disease Control (Table 8), (CDC, 1991). For community-level intervention to be successful at least five types of activities are necessary (CDC, 1991).

(1) screening and surveillance
determining populations at risk and the locations of the worst exposures;

(2) risk assessment and integrated prevention planning
analyzing all available data to assess sources of lead, exposure patterns, and high-risk populations; developing prevention plans;

(3) outreach and education
informing health-care providers, parents, property owners, and other key people about lead poisoning prevention;

(4) infrastructure development
finding the resources needed for a successful program of risk reduction;

(5) hazard reduction
reducing the hazards of lead-based paint and lead in dust and soil, particularly in high-risk buildings and neighborhoods.

Soil lead abatement

Soil lead abatement may consist of either establishing an effective barier between children and the soil or the removal and replacement of at least the top few centimeters of soil.

Summary

Exposure Pathways and Populations at Risk

Soil and dust act as pathways to children for lead deposited by primary lead sources such as lead in paint, leaded gasoline, and industrial or occupational sources of lead. Because lead does not dissipate, biodegrade, or decay, the lead deposited into dust and soil becomes a long-term source of lead exposure for children.

Preschool-age children and fetuses are usually the most vulnerable segments of the population for exposure to lead. Among children, those in the 2-3 year-old age bracket may be most at risk for exposure to lead-contaminated soil. The number of children potentially exposed to lead in dust and soil is estimated at 5.9 to 11.7 million children.

Uptake and Bioavailability of Lead

A strong positive correlation is found between exposure to lead- contaminated soils and PbB levels. Generally, the PbB levels rise 3-7 mcg/dl for every 1000 ppm increase in soil or dust concentrations. Access to soil, behavior patterns, presence of ground cover, seasonal variation of exposure conditions, and other factors may influence this relationship.

Bioavailability of lead in the gastrointestinal tract is influenced and may be reduced as the particulate size of lead is increased. The reduced bioavailability of lead from mine tailings may be related to its chemical form and its larger particulate size. Evaluations of mining sites require analyses of these physical- chemical parameters.

Biomarkers

The most commonly used biomarkers of lead exposure are the PbB concentration and the blood erythrocyte protoporphyrin (EP) concentration. The EP test has poor sensitivity and specificity below a PbB level of 25 mcg/dl. The CDC recommends PbB concentration as the screening test of choice.

Site-Specific Exposure Assessment

Interactive and complex factors associated with multiple exposure pathways for lead require a site-specific approach in order to develop meaningful action levels for lead in soil. When evaluating a site, a health assessor should be aware of multiple sources of lead exposure and the additive nature of the risks. Dust and soil lead -- derived from flaking, weathering, and chalking paint -- plus airborne lead fallout and waste disposal over the years, are the major proximate sources of potential childhood lead exposure.

Wide variations in soil lead levels have been reported, ranging from less than 100 ppm to well over 11,000 ppm. Soils adjacent to houses with exterior lead-based paints may have lead levels of >10,000 mcg/g. The downward movement of lead from soil by leaching is very slow under most natural conditions.

At a site, the health assessor should examine the available PbB data. Recently, the CDC has provided guidelines for interpreting PbB test results in children. If conditions at a site change dramatically, retesting exposed individuals may be necessary to determine the impact of altered conditions on PbB levels. The health assessor should pay attention to potential seasonal variation of exposure conditions; the half-life of lead in the blood stream; and limitations of any screening methods used, especially study design (power and representativeness of blood and soil samples), should be evaluated.

The health assessor should use caution in drawing conclusions when only one or a few soil samples from a site have been analyzed. Depending on the uniformity of lead distribution at a site, a single soil sample may significantly overestimate or underestimate the average lead concentration at a site. The impact of exposure to lead-contaminated soil on PbB levels is also influenced by the chemical and physical form of the lead.

ATSDR Recommendations

At all sites, ATSDR recommends that health assessors evaluate the need for any follow-up health activities. This effort should be coordinated with other health agencies, as appropriate, to ensure that all aspects of a site that impact the health of the community are evaluated. The recent statement by the CDC, Preventing Lead Poisoning in Young Children, provides guidance and identifies community prevention activities that should be triggered by PbB levels > or = 10 mcg/dl.

References

American Academy of Pediatrics (AAP) (1987) (Committee on Environmental Hazards and Committee on Accident and Poison Prevention of the American Academy of Pediatrics). Statement on childhood lead poisoning. Pediatrics, 79,457-65.

Agency for Toxic Substances and Disease Registry (ATSDR) (1988). The nature and extent of lead poisoning in children in the United States: A report to Congress, July 1988.

Agency for Toxic Substances and disease Registry (ATSDR) (1990). Case studies in environmental medicine: Lead toxicity.

Agency for Toxic Substances and Disease Registry (ATSDR) (1992). Toxicological profile for lead, ATSDR/TP-88/17.

Barltrop D. and Meek F. (1975). Absorption of different lead compounds, Postgrad Med J 51:805-9.

Barltrop D. and Meek F. (1979). Effect of particle size on lead absorption from the gut. Arch Environ Health 34:280-5.

Binder, S. and Matte, T. (1992). Personal Communication. Review of soil lead levels. May 8, 1992.

Centers for Disease Control (CDC), (1991). Preventing lead poisoning in young children, October 1991.

Chaney RL, et al. (1984). The potential for heavy metal exposure from urban gardens and soils, pages 37-84. In: J.R. Preer ed. Proceedings of the symposium on heavy metals in urban gardens. Agricultural Experiment Station, University of the District of Columbia, Washington.

Chisolm JJ, Jr. (1981). Dose effect relationship for lead in young children; evidence in children for interactions among lead, zinc, and iron. (Cited in ATSDR 1988)

Colorado Department of Health, (1990). University of Colorado at Denver, Agency for Toxic Substances and Disease Registry, Leadville Metals Exposure Study, April 1990.

Day JP, et al. (1979). Solubility and potential toxicity of lead in urban street dust. Bull Environ Contam Toxicol 23:497-502.

Duggan MJ and Williams S. (1977). Lead in dust in city streets. Sci Total Environ 7:91-7.

Duggan MJ. (1980). Lead in urban dust: an assessment. Water, Air, Soil Pollution 14:309-21.

Duggan MJ and Inskip MJ. (1985). Childhood exposure to lead in surface dust and soil: A community problem. Public Health Rev 13:1-54.

EPA (Environmental Protection Agency) (1986). Air quality criteria for lead, June 1986 and Addendum, September 1986. Research Triangle Park, N.C., EPA 600/8-83-018F.

EPA (Environmental Protection Agency) (1990). Uptake/biokinetic model for lead, Version 0.50 (December 1990).

EPA (Environmental Protection Agency) (1991). Three city urban soil-lead demonstration project, midterm project update.

Hammond PB. (1982). Inorganic lead in man's environment: Sources and toxicological significance. J Appl Toxicol 2(2):68-74.

Harrison RM. (1979). Toxic metals in street and household dusts. Sci Total Environ 11:81-97.

Healy M, et al. (1982). Lead sulfide and traditional preparations: Routes for ingestion and solubility and reactions in gastric fluid. J Clin Hosp Pharm 7:169-73.

Heard MJ and Chamberlain AC (1982). Effect of minerals and food on uptake of lead from the gastrointestinal track in humans. Hum Toxicol 1:411-5.

LaVelle MJ, et al. (1991). Bioavailability of lead in mining wastes: an oral intubation study in young swine (submitted for publication).

Madhaven S, et al. (1989). Lead in soil: Recommended maximum permissible levels. Environ Res 49:136-42.

Mahaffey KR, et al. (1976). Difference in dietary intake of calcium, phosphorus, and iron of children having normal and elevated blood lead concentrations. J Nutr 106(7). (Cited in ATSDR 1988).

Mahaffey KR, et al. (1982). National estimates of blood lead levels: United States, 1976-1980. N Engl J Med 307(10):573-9.

Markowitz ME and Rosen JF. (1981). Zinc (zn) and copper (Cu) metabolism in CaNa2 EDTA-treated children with plumbism. Pediatr Res 15:635. (Cited in ATSDR 1988).

National Research Council (1980). Lead in the human environment. Washington, DC: National Academy of Sciences.

Needleman HL, et al. (1990). The long-term effects of exposure to low doses of lead in childhood: An 11-year follow-up report. N Engl J Med 322(2):83-8.

NSF (National Science Foundation) (1977). Lead in the environment. NSF/RA-770214. Bogess,W.R., ed., NSF, Washington, D.C. (cited in EPA 1986a).

Que Hee SS, et al. (1985). Evolution of efficient methods to sample lead sources, such as house dust and hand dust, in the homes of children. Environ Res 38:77-95.

Reagan PL and Silbergeld EK. (1989). Establishing a health based standard for lead in residential soils. In: Hemphill and Cothern, eds. Trace substances in environmental health, Supplement to Volume 12,(1990) of Environmental Geochemistry and Health.

Schilling R and Bain RP. (1989). Prediction of children's blood lead levels on the basis of household-specific soil lead levels. Am J Epidemiol 128(1):197-205.

Steele MJ, et al. (1990). Assessing the contribution from lead in mining wastes to blood lead. Regul Toxicol Pharmacol 11:158-90.

Susten, A.S. (1990). The ATSDR health assessment: purpose, history, and findings. In: JS Andrews, et al. (eds.), Environmental issues: Today's challenge for the future. Proceedings of Fourth National Environmental Health Conference, June 20-23, 1989, San Antonio, Texas. U.S. Department of Health and Human Services, Public Health Service

Tola S, et al. (1973). Parameters indicative of absorption and biological effects in new lead exposure: A prospective study. Br J Ind Med 30:134-41.

Watson WS, et al. (1980). Oral absorption of lead and iron. Lancet (8188):236-7.

Yip R, et al. (1981). Iron status of children with elevated blood lead concentrations. J Pediatr 98: 922-5.

POINT OF CONTACT FOR THIS DOCUMENT:

To request a copy of this document or for questions concerning this document, please contact the person or office listed below. If requesting a document, please specify the complete name of the document as well as the address to which you would like it mailed. Note that if a name is listed with the address below, you may wish to contact this person via e-mail.

DR. CHARLIE XINTARAS
Agency for Toxic Substances and Disease Registry
1600 Clifton Road MS(E-28)
Atlanta, GA 30333
E-Mail: chx1@cdc.gov

Figure 1

Effects Of Inorganic Lead On Children And Adults
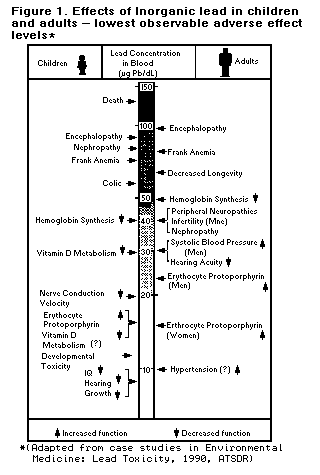
Figure 2

Soil Lead And Other Media Exposure

Figure 3

Blood And Soil Lead Correlation

Figure 4

Blood Lead And Percent > 10 mcg/dl

Table 8. Interpretation of blood lead test results and follow-up activities:
Class of child based on blood lead concentrations
Class Blood lead concentration (µg/dl Comment
I = or < 9 A child in Class I is not considered to be lead- poisoned
IIA 10-14 Many children (or a large proportion of children) with blood lead levels in this range should trigger community-wide childhood lead poisoning prevention activities. Children in this range may need to be screened more frequently.
IIB 15-19 A child in Class IIB should receive nutritional and educational interventions and more frequent screening. If the blood lead levels persist in this range, environmental investigation and intervention should be done.
III 20-44 A child in Class III should receive environmental evaluation and remediation and a medical evaluation. Such a child may need pharmacologic treatment of lead poisoning.
IV 45-69 A child in Class IV will need both medical and environmental interventions, including chelation therapy.
V = or > 70 A child in Class V lead poisoning is a medical emergency. Medical and environmental management must begin immediately

(Adapted from CDC, Preventing Lead Poisoning in Young Children. A Statement by the Centers for Disease Control, October, 1991. U.S. Department of Health aand Human Services/Public Health Service)


HOME PAGE

URL for "ATSDR Science Corner"

http://atsdr1.atsdr.cdc.gov:8080/cx.html

ATSDR Home Page

Charlie Xintaras / chx1@cdc.gov

Last Update July 15, 1995